Email campaign reports
Detailed reports are generated for every email you send. The data includes number of emails sent and delivered, unique opens, total opens, unique and total clicks, bounce rate, and much more.
In this article we'll explain some of the terms used in campaign reports, and give you a rundown of each of the reports available in your account.
View campaign reports
To access a campaign report:
- Login to the Newsletter dashboard
- Open the Campaigns section
- Go to the Sent campaigns on the left-hand side
- Click on the relevant campaign.
Your report snapshot will open, which is an overview of statistics for the sent campaign.
Terms used in reports
Below are explanations of the terms used, and the percentages you'll see displayed, in the campaign snapshot.
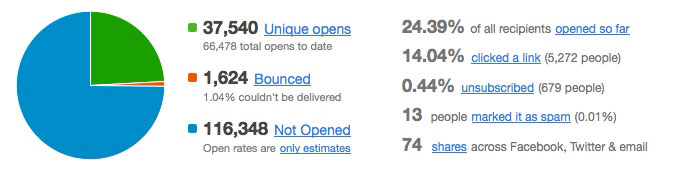
Bounces
Bounced emails are the number of email addresses that returned a soft or hard bounce. Below that is the percentage of emails sent that could not be delivered, because they bounced.
Clicks
The percentage displayed next to "clicked a link" is the total number of people who clicked a link (one or more links, one or more times), divided by the number of unique opens.
More detailed click data is available in the following reports: recipient activity, link activity and overlay, opens and clicks over time.
Clicks on links for unsubscribe, forward to a friend and subscriber preference center are not counted, but "view in browser" links are.
Opens
In the report snapshot you'll see the percentage of emails "opened so far". This is your open rate. You'll also see the following totals for opens:
Unique opens
One open is recorded for each individual recipient who opens the campaign.
Total opens to date
Displayed below unique opens, this is the total number of times your campaign has been opened. It includes multiple opens by the same recipient.
Not opened
The total number of recipients who we have not tracked an open for.
Learn more about email opens and tracking
Shares
The number of people who clicked a "share this email" link in your campaign, or who clicked the "forward to a friend" link.
Spam complaints
The number of recipients who marked your email as spam. It's important to keep an eye on this percentage; it's the number of complaints made compared to the total number of emails sent, and it should be less than 0.2%.
Unsubscribes
This is the total number of recipients who clicked the unsubscribe link in your campaign. The percentage is calculated as the number of people who opted out compared to the total number of emails sent.
Detailed reports
You can dig deeper using the reports listed in the right sidebar of your campaign report page.
Recipient activity
See opens and clicks by specific recipients. You can also click through from here to see which links your most engaged recipients clicked.
This report includes a "Not opened" tab where you can export subscribers who didn't open the email. To access it, go back to the snapshot view and click Not Opened, next to the pie chart.
Link activity and overlay
For extra click data, such as average clicks per person, and the percentage of people who didn't click any links. You can view the top-clicked links as a list, or by overlaying a heat map to see click percentages on the campaign itself. For the latter, click Email overlay at the top right.
Got lots of links in your campaign? In overlay mode, click View Top 5 for a visual representation of where clicks occur. You might see that most are at the top, or that buttons get more clicks than text links.
The rate at which your recipients share your emails is a good measure of engagement. It may not be a core measure of your ROI but shares are a highly valuable activity because they generate new contacts and help to build brand awareness in groups of people you may not have reached yet.
Worldview
There are few things more rewarding, after sending a campaign, than watching recipients open and interact with your content. Worldview plots your subscribers on a world map in real-time, dropping a geolocation pin each time someone opens, clicks or shares your campaign.
Opens and clicks over time
Use this report to work out the best time to schedule future emails, based on when your recipients are most responsive. Opens and clicks are recorded within time ranges so you can easily see what day of the week, and what hour of the day your subscribers were most active.
Time ranges available in the report are month, day, hour, and minute. You'll need to wait for a day after sending the email to be able to click through to hour and minute ranges. The month range only becomes available if opens or clicks are recorded in the month after your campaign was sent.
Email client usage
See which email clients, and devices, your subscribers use most. This information can help you focus on optimizing content or, if you code your own emails, help to determine how much time to spend coding for compatibility with various email platforms.
Compare reports
While there's a lot you can learn from the reports for a single campaign, it's important to monitor performance over time. For detailed metrics of campaign engagement over a set time period, you can use insights reporting.
You can also view overall statistics for a specific set of campaigns (excluding journey emails).